|
*percent error: amount of error (find the difference) divided by the actual amount.
*Circumference = pi times the diameter or 2 times the radius times pi. *Area of circle = pi times the radius squared *Types of graphs and when to use them: Bar Graph - categories Box plot - lots of data, to show variation Cirlce Graph - % Histogram - intervals, like 1-5 and 6-10 Line Graph - changes over time Line Plot - number line *Algebra steps: Remember ultimate goal - get the variable alone. First, move the constant (number without a letter) by either adding or subtracting. Then, move the coefficient (number right next to the letter) by multiplying or dividing.
*Triangles: Sum of angles in a triangle is 180 degrees. The sum of any two sides must greater than the 3rd side. The category names for the sides of triangles: scalene (none the same), isosceles (two sides the same), and equilateral (all sides the same). The category names for the angles of triangles: acute, obtuse, and right. *Combining like terms: Remember you can only combine terms that match exactly (same letter, or no letter) *Integer rules: Remember, subtracting is adding a negative. Adding: if they have the same sign, add like normal and keep the sign. If they have different signs, find the difference, keep the sign of the bigger number. Multiplying/dividing: positive times a positive is positive (+*+=+), negative times a negative is positive (-*-=+). Negative times positive is negative(-*+=-), positive times negative is negative (+*-=-). *Unbiased samples = equal representation: simple random sample, systematic random sample Biased samples = uneven representation: convenience sample, voluntary response * Complex fractions (a fraction made up of fractions) is just fraction division. Rewrite it sideways then remember keep change flip. In other words, fraction division is multiplying by the reciprocal.
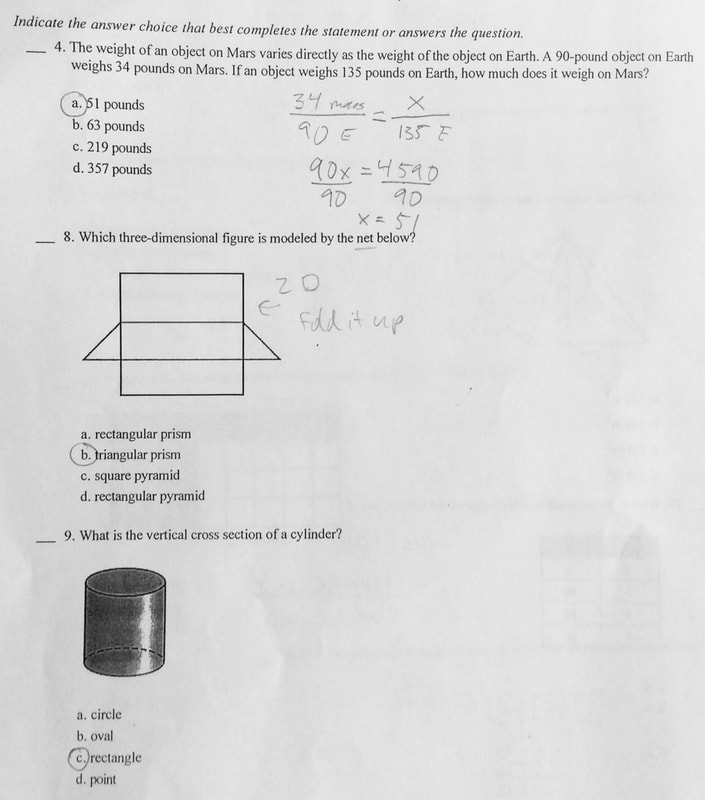
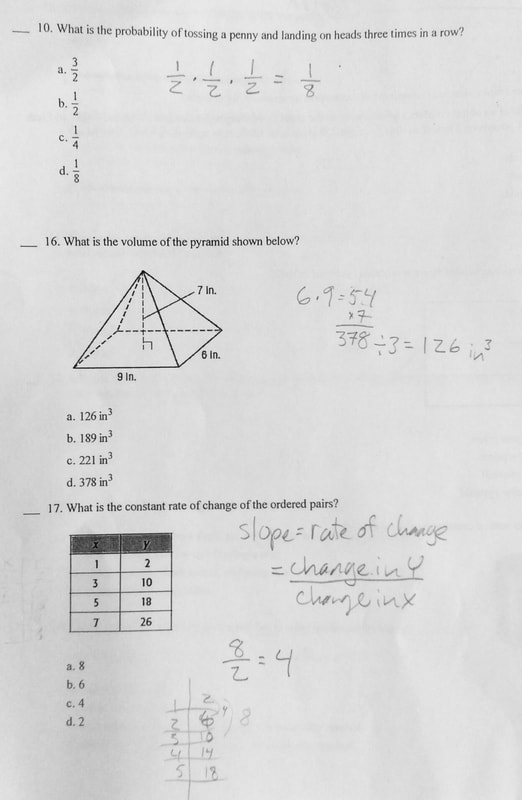
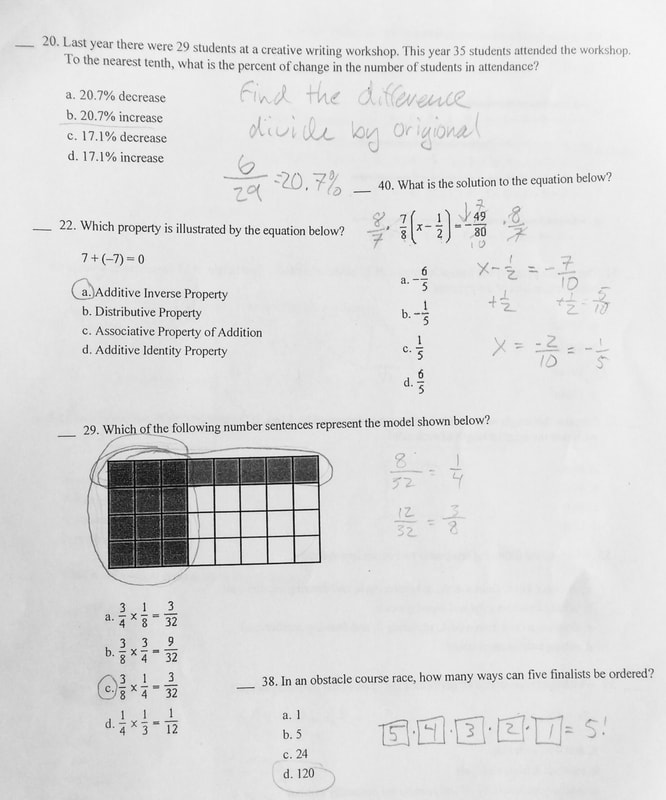
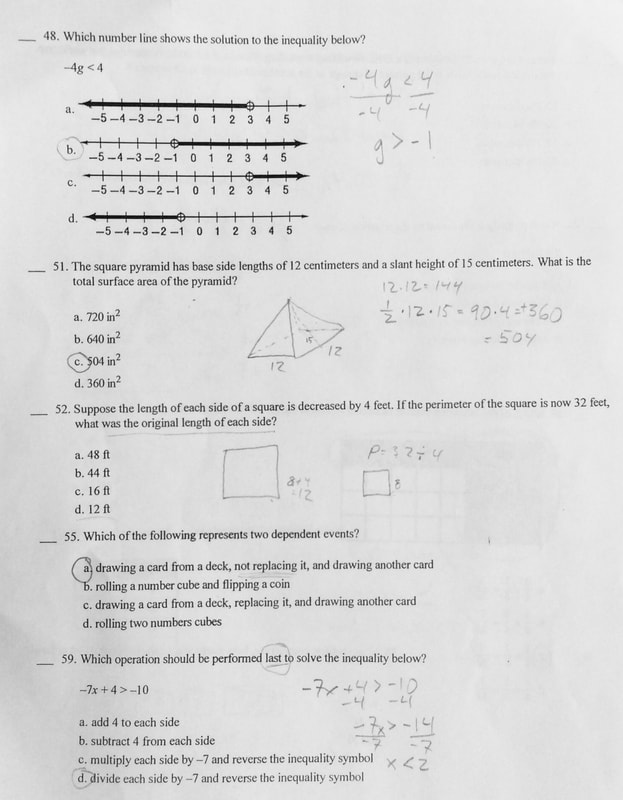
*Percent equation - know it: % times whole = part *Percent of change: find the difference, then divide by the original number, change the decimal to a percent. *Complementary angles (common man) add up to 90 degrees *Supplementary angles (super man) add up to 180 degrees *Constant of proportionality: same thing as slope. The change in y over the change in x. *Solving inequalities: the only difference is if you multiply or divide by a negative you MUST flip the inequality. *Unit Rate: comparison of some number to 1 of something else. Miles per hour, price per ounce *Adjacent Angles: right next to, share 1 side. *vertical Angles: directly across from each other. Also, equal! Test tomorrow! Go through each of the sections in your book and all of your notes to make sure you've got all of the ideas down! Good luck!
Figure out the probability for each event (dependent or independent) and multiply those probabilities together to get the probability of the combined events. 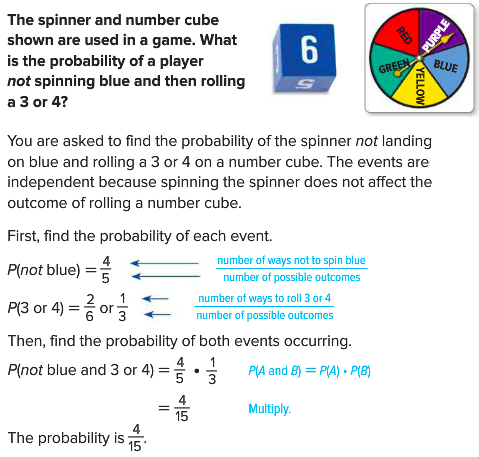 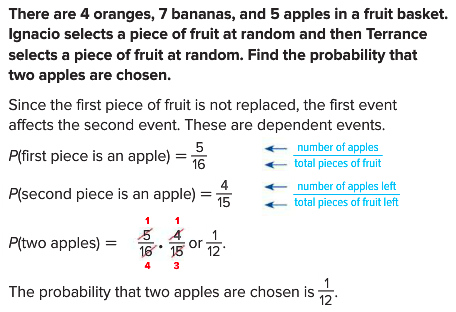 No, a permutation is not when your perm goes bad. Hee hee. Permutations are ways to find combinations of things that don't have repeats. So, for example, if you are picking a 4 didget code for your garage door, but can't have repeated numbers you have 10 choices for the first number, then 9 choices for the second number, 8 choices for the third, and 7 for the last number. Multiply them together and there are 5040 combinations of 4 numbers with no repeats. For the students, this is where I make boxes and then fill them in. 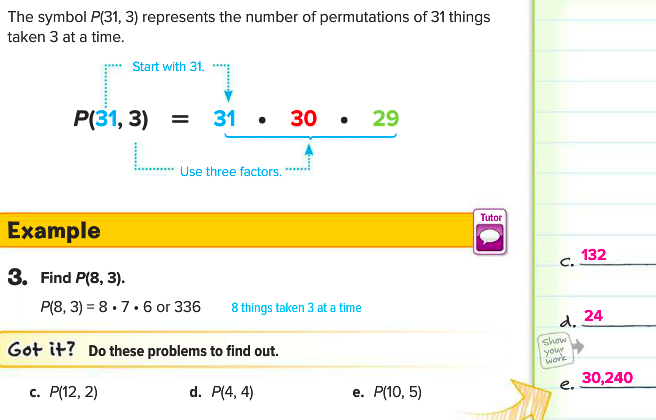 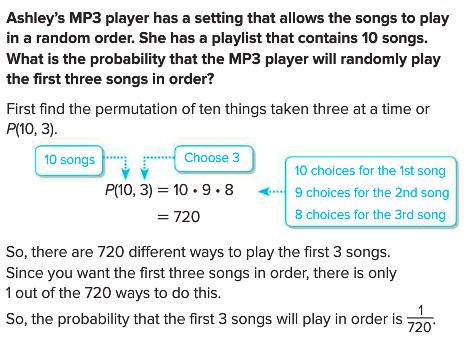 You can use multiplication instead of a tree diagram to find the number of possible outcomes in a sample space. This is called the Fundamental Counting Principle. Basically, you determine the possible outcomes for each event and multiply them together to get the number of combinations. 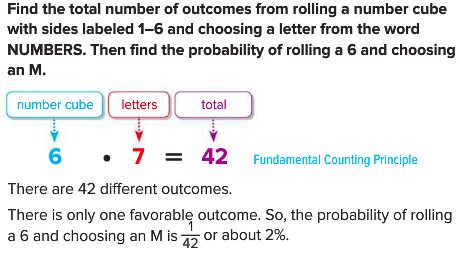 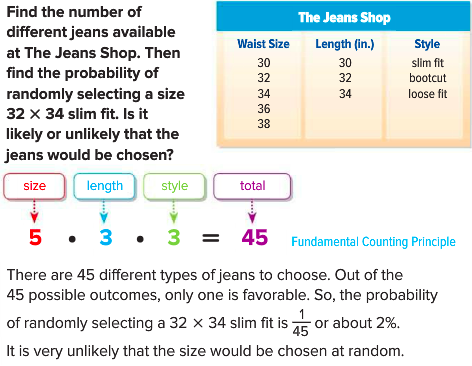 The whole point of this section is to show that you can simulate a real world situation with an easier to work with experiments, as long as the total possible number of outcomes is the same. So, to simulate how long it will take to get all 4 toys out of a cereal box, you can roll a 4 sided dice and count how many times it takes to get all 4 numbers. 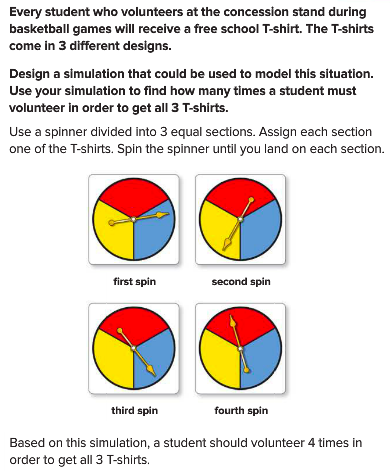 Flipping a coin is a simple event. Flipping 3 coins is a compound event, meaning 2 or more events combined. Figuring out the sample space, or possible outcomes, of compound events is made easier by making a chart or tree diagram. Righting out all the possible outcomes helps to figure out not only the sample space (the number on the bottom of our probability) but also all the ways to get what we want (the number on the top of the probability). See the examples from the book on different ways to write out the possibilities. 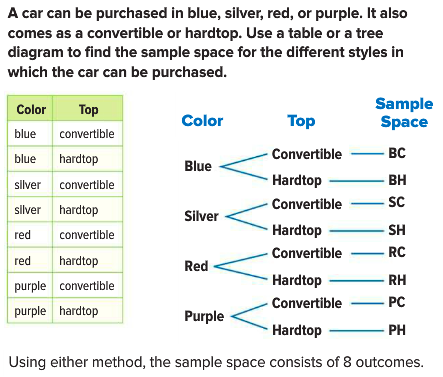 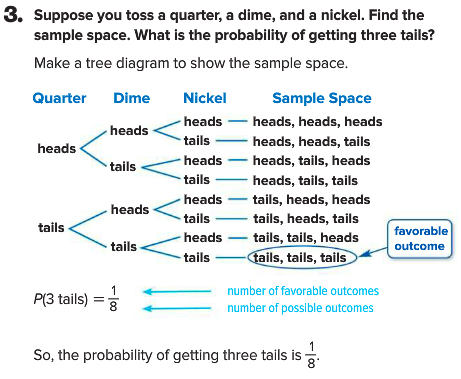 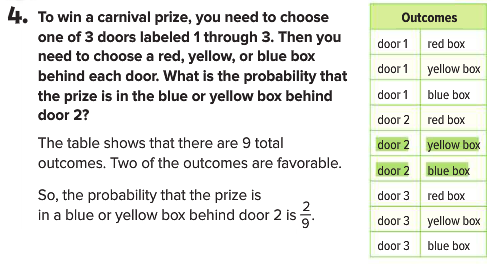 |
AuthorI thought this would be a great spot to put the daily notes, so if you ever miss, or don't understand, you can check here. Archives
May 2018
Categories |
 RSS Feed
